Charts & Graphs
Explore Thousands of Free Microsoft PowerPoint and Google Slides Presentation Charts & Graphs. SlidesGeek offer free resources for its users to help them in creating effective, impressive, professional and creative Presentations in PowerPoint and Google Slides.
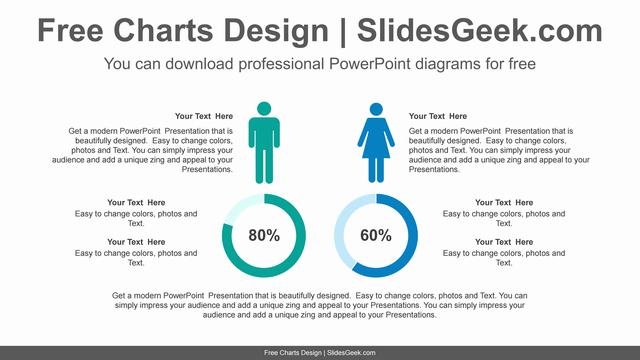
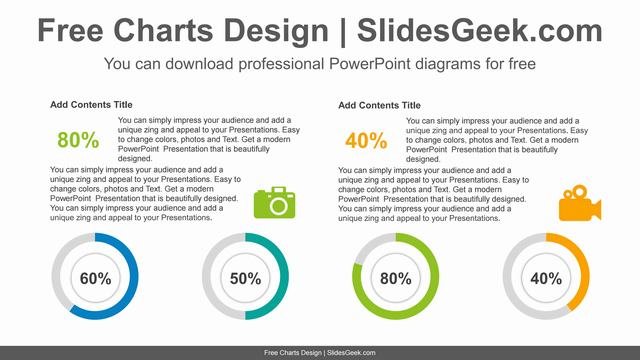
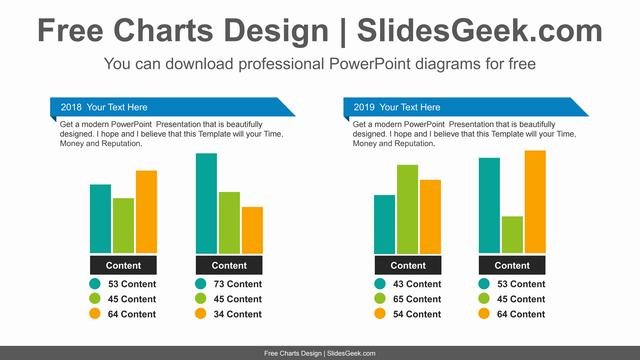
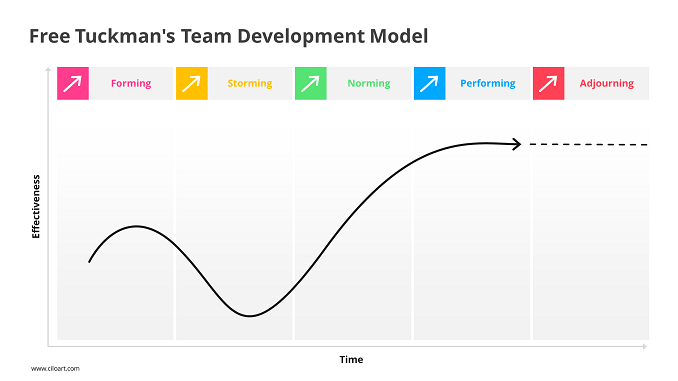
When it comes to creating presentations, having accurate and visually appealing data is key. Downloading charts and graphs infographics can help you achieve this. In this page, you can explore a range of different infographic designs of charts and graphs. This can give you an idea of what will work best for your presentation needs.
You can download free presentation templates that include these infographic charts and graphs. This way, you can easily create professional-looking slideshows that will impress your audience. Whether you need to present data from surveys or research studies, using charts and graphs infographics can help make your data more understandable and engaging.
Search for 3D Designs, Pie Charts, Gantt Charts, Projection Charts and Designs. Create Professional and Best Presentations using resources from SlidesGeek. Use Advanced Search tool to search for your requirement.
