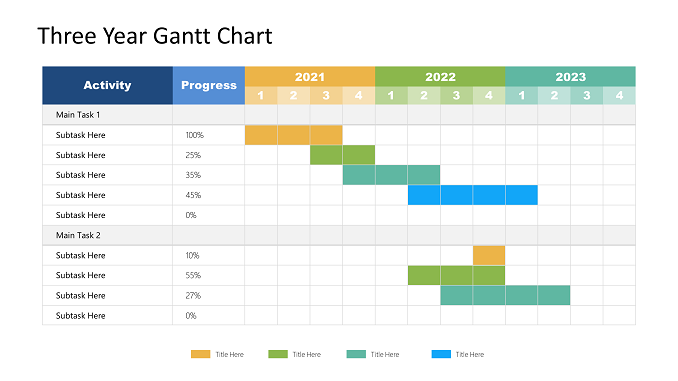
Three Years Gantt Chart is an infographic design useful to showcase project timeline, project milestones, Gantt Charts etc. Use this Gantt Chart PPT to create impressive slide related to project status, activies in your project, milestones, works completion and many more. Gantt Chart ppt in your presentations can be a project storyteller.
Presentations are effective when they have ability to tell project status, project stories and showcase future project plans. As an essential part of storytelling, timeline and Gantt Chart related slides or infographic design can be helpful.Free Gantt Chart PPT and Project Timelines Templates available at Slides Geek.
Presentations are effective when they have ability to tell project status, project stories and showcase future project plans. As an essential part of storytelling, timeline and Gantt Chart related slides or infographic design can be helpful.Free Gantt Chart PPT and Project Timelines Templates available at Slides Geek.
[free] Download Gantt Chart Template in Excel
Three Years Gantt Chart PowerPoint templates is ideal for providing for planning project delivery. You can use Three Years Gantt Chart PowerPoint to present timeline to depict the time required to complete each process of the project.
This Free PowerPoint template is a 100% editable PPT templates that can be customized to presentation requirements and PPT background color and PPT themes.
This template focuses mainly in the projection and forecast of project for Three Years Gantt Chart. Projects are usually divided into period wise activities (yearly, monthly and Quarterly or specific time) and reporting thereof.
Features of three years Gantt Chart Slide template
- 100% Editable PowerPoint Templates.
- Easy to showcase Milestones of a project
- Work breakdown structure definable
- Compatible with all major Microsoft PowerPoint versions, Keynote and Google Slides.
- Modern 16:9 Aspect Ratio.
- Scalable Vectoral PowerPoint Shapes and PowerPoint Icons.
- Instant Access and Download.
