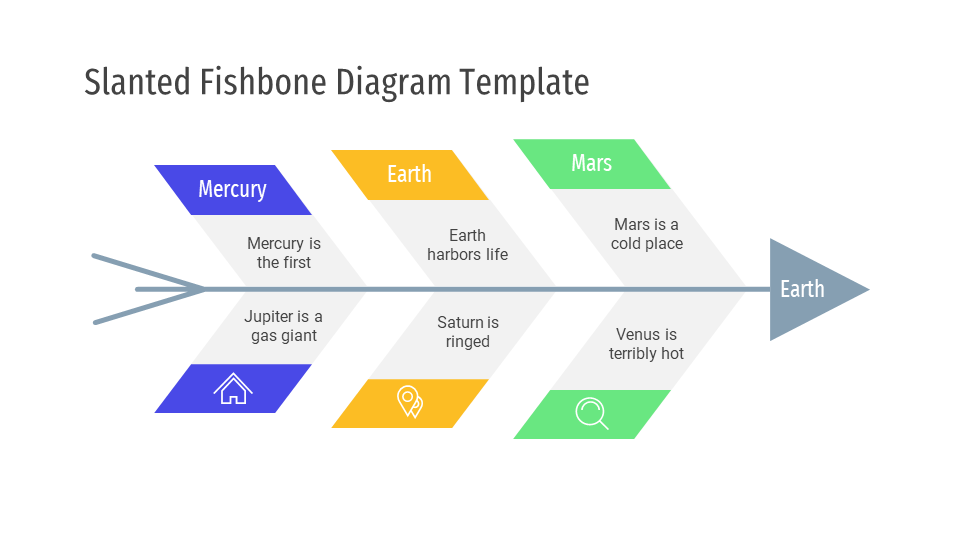
Slanted Fishbone Diagram is a free fishbone diagram template for Microsoft PowerPoint and Google Slides.
Understanding Fishbone diagrams
Fishbone diagrams are also known as Ishikawa Diagrams. Ishikawa diagrams are causal diagrams created by Kaoru Ishikawa that show the potential causes of a specific event. Common uses of the Ishikawa diagram are product design and quality defect prevention to identify potential factors causing an overall effect.
A fishbone diagram is a visualization tool for categorizing the potential causes of a problem. This tool is useful in order to identify a problem’s root causes. Typically, it is useful for root cause analysis and a fishbone diagram combines the practice of brainstorming with a type of mind map template. It should be efficient as a test case technique to determine cause and effect.
A Fishbone diagram is a problem analysis technique use by Business Analysts. It helps understand the root causes of a business problem. Sometimes the root cause of the problem may be obvious. At other times, only the symptoms may appear. Fishbone diagrams are similar to mind maps but are purely diagnostic.
Using Five Whys Analysis with Fishbone Diagram
The 5 Whys method also allows you to follow multiple lanes of inquiry. This method helps you get into the root case of any problem statement quickly.
You can use 5 Whys for troubleshooting, quality improvement, and problem solving, but it is most effective when used to resolve simple or moderately difficult problems.
The 5 Whys strategy is a simple, effective tool for uncovering the root of a problem. Start with a problem and ask why it is occurring. Make sure that your answer is grounded in fact, and then ask the question again. Continue the process until you reach the root cause of the problem, and you can identify a counter-measure that will prevent it from recurring.
Bear in mind, that this questioning process is best suited to simple or moderately difficult problems. Complex problems may benefit from a more detailed approach, although using 5 Whys will still give you useful insights.
Download and use fishbone Diagram Template
To use this free Fishbone diagram template for Presentations, you should have Microsoft Office/ Microsoft PowerPoint. You can only use this template if you have these applications in your system. or Use, Google Slides.
After installing PowerPoint or Google Slides, download the zip file of this template. Now, extract the template using WinRAR or 7Zip decompressing software. Once extracted, you can open the file using PowerPoint and start entering data or customizing the template.
When to use a fishbone diagram ?
Below are some of the few reasons why you might want to consider using a fishbone diagram -
Download this fishbone diagram and create best, wonderful, professional and creative presentation template and slides with Slanted Fishbone Diagram in Microsoft PowerPoint and Google Slides .


