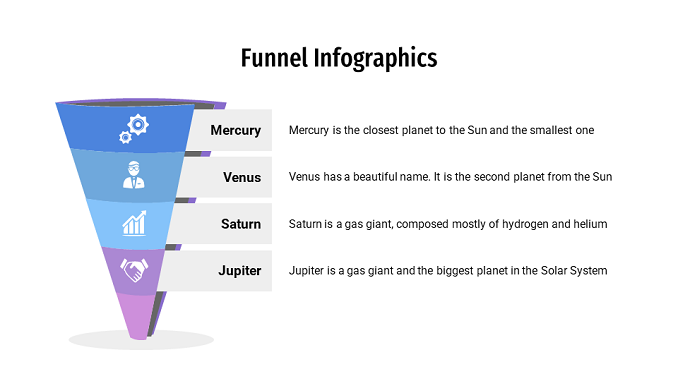
Funnel charts in Presentations can be helpful for you to showcase your sales, revenue and customer movement.
Download this free simple funnel chart PowerPoint template. Enhance the visualization in your presentations using this template. Customize the color scheme to bring in more details.
What are funnels in marketing ?
One of the most common uses is in marketing and sales to show how the number of potential sales prospects gradually winnows to those who complete purchases. A marketing funnel describes your customer's journey with you. From the initial stages when someone learns about your business, to the purchasing stage, marketing funnels map routes to conversion and beyond.
Lead management
Lead Management is the process of acquiring and managing leads (potential customers) until the point where they make a purchase. This is a more involved process than standard advertising, and is most applicable to ecommerce stores that generate individual relationships with customers.
For more visit : Big Commerce
Funnel charts for sales and marketing presentations
A funnel chart is a specialized chart type that demonstrates the flow of users through a business or sales process. The chart takes its name from its shape, which starts from a broad head and ends in a narrow neck. The number of users at each stage of the process are indicated from the funnel’s width as it narrows.
Funnel charts are most often seen in business or sales contexts, where we need to track how a starting set of visitors or users drop out of a process or flow. This chart type shows how the starting whole breaks down into progressive parts.
Best practices while using a funnel chart in Presentation
Below are some of the known and industry wide applicable best practices while using funnel charts in your presentation. Please, go through them once, before you download this funnel design template -
- Try to include at least three stages in your funnel design. Two stages can be useful while playing with pie chart or single stacked bar diagram. However, funnel chart is effective and efficient with minimum three levels only.
- Deep down the core, funnel charts are bar charts with some fancy customization. Here, Bars are centrally aligned and connected with other graphical elements. While the best way to create a funnel chart is to essentially make a center-aligned bar chart, it is often a better idea overall to just use the bar chart instead.
- While a funnel chart expects a simple, linear process, a Sankey diagram can depict multiple sources of input and output. Like a funnel chart, value is encoded in the width of the chart on each segment of the visualization, but those segments may not be regularly spaced out. Thus, please choose the best chart for your visualization.
Download and use this funnel diagram presentation template
In order to get this presentation template and use it in your presentation, follow the steps below -
- Hit the download button in this page. You will get a compressed file.
- Extract the compressed file with decompressor software like 7Zip and WinRAR.
- Open the template using PowerPoint, WPS Office, Libre Office or any other PPTX supporting software.
- Start customizing your funnel chart.
