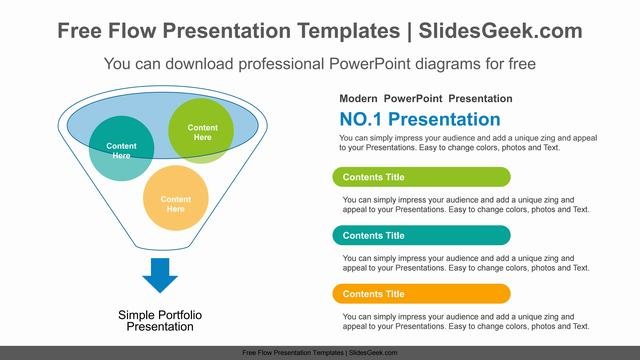
Funnel charts in Presentations can be helpful for you to showcase your sales, revenue and customer movement.
While drafting presentations, requirement of showcasing business flow, information flow, work flow or say channel associated for data or information of any business, service, assessment, research or project is immense. Presentations without any work flow illustration around it is not good or say, effective/ impactful.
Professionals require work flow or process flow slides to engage customers/ clients or potential investors and help them in understanding the business or agenda of the work in an effective manner.
- Business process flow slide for presentations
- Workflow presentation slide
- Sales journey flow presentation slide
- Initiative work flow presentation slide
- PowerPoint Process Flow
- Workflow template PowerPoint design
- Progress reports and infographics
- PowerPoint Progress Slide Template
- Process Note Listing Presentation Slide
- Sales Funnel Presentation Slide
- Sales Process Insights Presentation Slide
Students and teachers require process flow or work flow slides in their presentations to show their approach for the project or any social issue related research along with visualization on the channel or flow of information, how they implemented their approach. Presentation Design like this can be helpful for creating an effective and impactful presentation.
Basic Features of this Free Workflow Template Presentation design
- Fully editable and easy to edit workflow and process flow based PowerPoint Presentation design
- Colorful Chart or/ and Graph Slide to showcase history, as applicable
- Contain editable charts, graphics, icons and colors
- Templates useable in Google Slides and Microsoft PowerPoint
- 16:9 widescreen format suitable for all types of displays and screens
- Minimal design with value addition capability
