Simple Funnel 2 Levels is an funnel diagram ppt template for PowerPoint and Google Slides. This template can help you in data visualization and making readers understand the data better.
Funnel charts in Presentations can be helpful for you to showcase your sales, revenue and customer movement.
What is funnel chart?
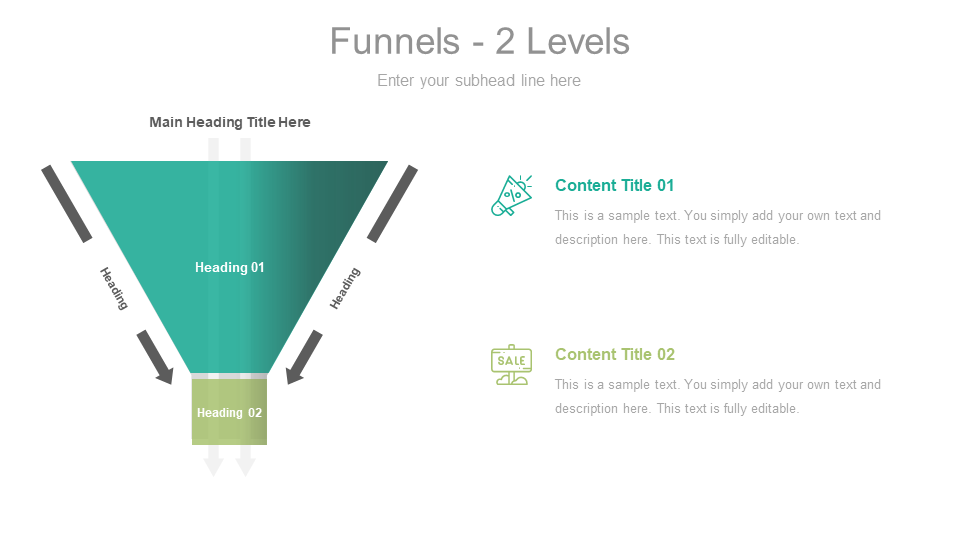
Funnel charts are a type of chart, often used to represent stages in a sales process and show the amount of potential revenue for each stage. This type of chart can also be useful in identifying potential problem areas in an organization’s sales processes. A funnel chart is similar to a stacked percent bar chart.
What are funnel charts useful for ?
Funnel charts are a type of chart, often used to represent stages in a sales process and show the amount of potential revenue for each stage. This type of chart can also be useful in identifying potential problem areas in an organization's sales processes. A funnel chart is similar to a stacked percent bar chart.
Visualizing your funnel with a bar chart is a great way to identify points of friction in your user journey. Each step your customer takes on their way to conversion has a barrier to entry with varying degrees of friction.